During gene expression in eukaryotes, almost all newly transcribed pre-mRNAs are subjected to polyadenylation, a
process in which the pre-mRNA is cleaved at 3' end and a poly(A) tail is added. Because the poly(A) tail marks
the end of a mature mRNA, the choice of alternative poly(A) sites in the same genes, also known as alternative
polyadenylation (APA), may generate different mRNAs with distinct sequence contents and functions (Tian and Manley, 2017).
APA is increasingly recognized as an important regulator for eukaryotic gene expression. Recent large-scale studies using
3' end sequencing (3' seq) revealed that extensive APA exists in different systems from yeast to
humans (Derti, et al., 2012; Li, et al., 2012; Smibert, et al., 2012; Ulitsky, et al., 2012; Hoque, et al., 2013).
In plants and algae, current genome-wide data analyses suggest that about 50-70% of the genes show evidence of
APA (Shen, et al., 2008; Shen, et al., 2011; Wu, et al., 2011; Sherstnev, et al., 2012;
Fu, et al., 2016; Wang, et al., 2017; Chakrabarti, et al., 2018; Zhou, et al., 2019).
APA has been demonstrated in the regulation of genes that are involved in flowering time control, amino acid biosynthesis,
plant incompatibility, oxidative stress responses,
and among others (Sherstnev, et al., 2012; Thomas, et al., 2012; Hong, et al., 2017; Lin, et al., 2017; Fu, et al., 2019;
Zhou, et al., 2019).
PlantAPAdb provides a comprehensive and manually curated catalog of APA sites in plants based
on a large volume of data from diverse biological samples generated by 3' seq.
Currently, PlantAPAdb contains APA sites in seven plant organisms,
including Oryza sativa L. (japonica and
indica), Arabidopsis thaliana, Chlamydomonas reinhardtii, Medicago truncatula,
Trifolium pratense, Populus trichocarpa
and Phyllostachys edulis.
PlantAPAdbcatalogues APA sites in different tissues in various
physiological and pathological conditions, which were seuqenced from diverse 3' seq protocols
and biological samples. A one-click search is
integrated in PlantAPAdb, which enables the query of the whole database without
limiting any search field. We designed a uniform and flexible processing pipeline for
identifying high-confidence poly(A) sites from 3' seq, which allows the incorporation of
all publically available or emerging sequencing data sets. We also developed a standard
procedure for parsing genome annotation file obtained from a unified
portal (Ensembl Plants), facilitating the annotation of poly(A) sites in a highly
flexible way. PlantAPAdb provides rich information of the whole genome poly(A) sites,
including genomic locations, heterogeneous cleavage sites, expression levels,
related poly(A) signals, sample information, conservation information, etc.
APA sites can be visualized in their genomic context via the Jbrowse genome browser.
PlantAPAdb also provides full lists of poly(A) signals for poly(A) sites in different
genomic regions and users are also free to download sequences surrounding poly(A)
sites of selected groups. Moreover, PlantAPAdb contains comprehensive lists of APA sites
and genes involving in 3' UTR shortening/lengthening between two biological
samples with different methods and filtration conditions.
PlantAPAdb also provides quantification of APA sites using several metrics,
such as tissue specificity, poly(A) site usage, relative usage of distal poly(A) site (RUD), average 3' UTR length.
More importantly, additional information about conservation of poly(A) sites across
plants is also available in PlantAPAdb,
providing insights into the polyadenylation configuration between species.
Data from pooled samples and individual samples in PlantAPAdb are allowed for bulk download as flat files.
Pipeline and scripts used for APA analyses in PlantAPAdb can be downloaded here.
As a user-friendly database, PlantAPAdb is a large and extendable resource for improving genome annotation and
elucidating APA mechanism, APA conservation and APA-mediated gene expression regulation.
If you have any questions or comments, please email to xhuister@xmu.edu.cn (Dr. Xiaohui Wu).
Shen, Y., et al. (2008) Genome level analysis of rice mRNA 3'-end processing signals and alternative polyadenylation, Nucleic Acids Res., 36, 3150-3161.
Fu, Y., et al. (2011) Differential genome-wide profiling of tandem 3' UTRs among human breast cancer and normal cells by high-throughput sequencing, Genome Res., 21, 741-747.
Shen, Y., et al. (2011) Transcriptome dynamics through alternative polyadenylation in developmental and environmental responses in plants revealed by deep sequencing, Genome Res., 21, 1478-1486.
Wu, X., et al. (2011) Genome-wide landscape of polyadenylation in Arabidopsis provides evidence for extensive alternative polyadenylation, Proc. Natl. Acad. Sci. USA, 108, 12533-12538.
Derti, A., et al. (2012) A quantitative atlas of polyadenylation in five mammals, Genome Res., 22, 1173-1183.
Li, Y., et al. (2012) Dynamic landscape of tandem 3 ' UTRs during zebrafish development, Genome Res., 22, 1899-1906.
Sherstnev, A., et al. (2012) Direct sequencing of Arabidopsis thaliana RNA reveals patterns of cleavage and polyadenylation, Nat. Struct. Mol. Biol., 19, 845-852.
Smibert, P., et al. (2012) Global Patterns of Tissue-Specific Alternative Polyadenylation in Drosophila, Cell Reports, 1, 277-289.
Thomas, P.E., et al. (2012) Genome-Wide Control of Polyadenylation Site Choice by CPSF30 in Arabidopsis, Plant Cell, 24, 4376-4388.
Ulitsky, I., et al. (2012) Extensive alternative polyadenylation during zebrafish development, Genome Res., 22, 2054-2066.
Hoque, M., et al. (2013) Analysis of alternative cleavage and polyadenylation by 3 ' region extraction and deep sequencing, Nat. Methods, 10, 133-139.
Fu, H., et al. (2016) Genome-wide dynamics of alternative polyadenylation in rice, Genome Res., 26, 1753-1760.
Hong, L., et al. (2017) Alternative polyadenylation is involved in auxin-based plant growth and development, The Plant Journal, n/a-n/a.
Lin, J., et al. (2017) Role of Cleavage and Polyadenylation Specificity Factor 100: Anchoring Poly(A) Sites and Modulating Transcription Termination, The Plant Journal.
Tian, B. and Manley, J.L. (2017) Alternative polyadenylation of mRNA precursors, Nature reviews. Molecular cell biology, 18, 18-30.
Wang, T., et al. (2017) Comprehensive profiling of rhizome-associated alternative splicing and alternative polyadenylation in moso bamboo (Phyllostachys edulis), Plant J, 91, 684-699.
Arefeen, A., et al. (2018) TAPAS: Tool for Alternative Polyadenylation Site Analysis, Bioinformatics, bty110-bty110.
Chakrabarti, M., Dinkins, R.D. and Hunt, A.G. (2018) Genome-wide atlas of alternative polyadenylation in the forage legume red clover, Scientific Reports, 8, 14.
Ye, C., et al. (2018) APAtrap: identification and quantification of alternative polyadenylation sites from RNA-seq data, Bioinformatics, 34, 1841-1849.
Fu, H., et al. (2019) Distinct genome-wide alternative polyadenylation during the response to silicon availability in the marine diatom Thalassiosira pseudonana, The Plant Journal, 99, 67-80.
Zhou, Q., et al. (2019) Differential alternative polyadenylation contributes to the developmental divergence between two rice subspecies Japonica and Indica, The Plant Journal, 98, 260-276.
PlantAPAdb catalogues all PAC (poly(A) site cluster) datasets,
which are well organized by different categories such as sequencing protocols,
biological samples, relevant authors and studies, and published year.
Each dataset is displayed by a dataset card. By clicking the card of a dataset,
users can view detailed statistical information of the dataset, such as the relevant
study and literature, mapping information of the raw data, statistics of PAC and read
distribution in different genomic regions. Lists of all potential PACs and high confidence
PACs in simple bed format or with full genome annotation are provided for download.
The list of heterogeneous cleavage sites before grouping into PACs is also provided for
download, which is especially useful for analyzing the micro-heterogeneity
phenomenon of polyadenylation or testing the impact of clustering procedure.
Each catalogue (dataset card) contains PACs from one biological sample
(e.g., one tissue with multiple replicates). Raw RNA-seq data from this
sample were pre-processed using the standard pipeline. It should be noted that the
coordinates of PACs in this single sample are not necessarily all in (or the same as)
the coordinates of all PACs from the whole species, because PACs in a
single sample are not extracted from the pooled sample.
Protocols
Description
Studies
Cite
PAT-seq
A method to study the integration of 3' UTR dynamics with gene expression in the eukaryotic transcriptome
Harrison P F, Powell D R, Clancy J L, et al. PAT-seq: a method to study the integration of 3' UTR dynamics with gene expression in the eukaryotic transcriptome[J]. Rna, 2015, 21(8): 1502-1510.
PAS-seq
A deep sequencing-based method called Poly(A) Site Sequencing (PAS-Seq) for quantitatively profiling RNA polyadenylation at the transcriptome level
Rallapalli G, Kemen E M, Robert-Seilaniantz A, et al. EXPRSS: an Illumina based high-throughput expression-profiling method to reveal transcriptional dynamics[J]. BMC genomics, 2014, 15(1): 341.
Studies
Species
Cite
Wu X, 2011
Arabidopsis thaliana
Wu X, Liu M, Downie B, et al. Genome-wide landscape of polyadenylation in Arabidopsis provides evidence for extensive alternative polyadenylation[J]. Proceedings of the National Academy of Sciences, 2011, 108(30): 12533-12538.
Sherstnev A, 2012
Arabidopsis thaliana
Sherstnev A, Duc C, Cole C, et al. Direct sequencing of Arabidopsis thaliana RNA reveals patterns of cleavage and polyadenylation[J]. Nature structural & molecular biology, 2012, 19(8): 845.
Thomas P E, 2012
Arabidopsis thaliana
Thomas P E, Wu X, Liu M, et al. Genome-wide control of polyadenylation site choice by CPSF30 in Arabidopsis[J]. The Plant Cell, 2012, 24(11): 4376-4388.
Duc C, 2013
Arabidopsis thaliana
Duc C, Sherstnev A, Cole C, et al. Transcription termination and chimeric RNA formation controlled by Arabidopsis thaliana FPA[J]. PLoS genetics, 2013, 9(10): e1003867.
Liu M, 2014
Arabidopsis thaliana
Liu M, Xu R, Merrill C, et al. Integration of developmental and environmental signals via a polyadenylation factor in Arabidopsis[J]. PloS one, 2014, 9(12): e115779.
Rallapalli G, 2014
Arabidopsis thaliana
Rallapalli G, Kemen E M, Robert-Seilaniantz A, et al. EXPRSS: an Illumina based high-throughput expression-profiling method to reveal transcriptional dynamics[J]. BMC genomics, 2014, 15(1): 341.
Wu X, 2014
Medicago truncatula
Wu X, Gaffney B, Hunt A G, et al. Genome-wide determination of poly (A) sites in Medicago truncatula: evolutionary conservation of alternative poly (A) site choice[J]. BMC genomics, 2014, 15(1): 615.
Zhang Y, 2015
Arabidopsis thaliana
Zhang Y, Gu L, Hou Y, et al. Integrative genome-wide analysis reveals HLP1, a novel RNA-binding protein, regulates plant flowering by targeting alternative polyadenylation[J]. Cell research, 2015, 25(7): 864.
Bell S A, 2016
Chlamydomonas reinhardtii
Bell S A, Shen C, Brown A, et al. Experimental genome-wide determination of RNA polyadenylation in Chlamydomonas reinhardtii[J]. PloS one, 2016, 11(1): e0146107.
Fu H, 2016
Oryza sativa Japonica Group
Fu H, Yang D, Su W, et al. Genome-wide dynamics of alternative polyadenylation in rice[J]. Genome research, 2016, 26(12): 1753-1760.
Guo C, 2016
Arabidopsis thaliana
Guo C, Spinelli M, Liu M, et al. A genome-wide study of “non-3UTR” polyadenylation sites in Arabidopsis thaliana[J]. Scientific reports, 2016, 6: 28060.
de Lorenzo L, 2017
Arabidopsis thaliana
de Lorenzo L, Sorenson R, Bailey-Serres J, et al. Noncanonical alternative polyadenylation contributes to gene regulation in response to hypoxia[J]. The Plant Cell, 2017, 29(6): 1262-1277.
Hong L, 2017
Arabidopsis thaliana
Hong L, Ye C, Lin J, et al. Alternative polyadenylation is involved in auxin‐based plant growth and development[J]. The Plant Journal, 2018, 93(2): 246-258.
Lin J, 2017
Arabidopsis thaliana
Lin J, Xu R, Wu X, et al. Role of cleavage and polyadenylation specificity factor 100: anchoring poly (A) sites and modulating transcription termination[J]. The Plant Journal, 2017, 91(5): 829-839.
Chakrabarti M, 2018
Trifolium pratense
Chakrabarti M, Dinkins R D, Hunt A G. Genome-wide atlas of alternative polyadenylation in the forage legume red clover[J]. Scientific reports, 2018, 8(1): 11379.
Wang T, 2018
Phyllostachys edulis
Wang T, Wang H, Cai D, Gao Y, Zhang H, Wang Y, et al. Comprehensive profiling of rhizome-associated alternative splicing and alternative polyadenylation in moso bamboo (Phyllostachys edulis)[J]. Plant J, 2017, 91(4), 684-699. doi: 10.1111/tpj.13597.
Telléz‐Robledo B, 2019
Arabidopsis thaliana
Tellez-Robledo, B., et al. The polyadenylation factor FIP1 is important for plant development and root responses to abiotic stresses [J]. The Plant Journal, 2019, 99(6):1203-1219.
Zhou Q, 2019
Oryza sativa Indica Group
Zhou Q, Fu H, Yang D, et al. Differential alternative polyadenylation contributes to the developmental divergence between two rice subspecies, japonica and indica[J]. The Plant Journal, 2019, 98(2): 260-276.
Organism
SRP group label
Environment condition
Plant type
Procotol
Tissue
Reference
arabidopsis_thaliana
Buffer Control (SRP089899)
Control
Wild type
PAT-seq
Seedling
de Lorenzo et al. The Plant Cell, 2017.
arabidopsis_thaliana
Seedling Control (SRP089899)
Control
Wild type
PAT-seq
Seedling
de Lorenzo et al. The Plant Cell, 2017.
arabidopsis_thaliana
Cordycepin 2h (SRP089899)
Cordycepin
Wild type
PAT-seq
Seedling
de Lorenzo et al. The Plant Cell, 2017.
arabidopsis_thaliana
FLAG-RPL18 Control (SRP089899)
Control
FLAG-RPL18
PAT-seq
Seedling
de Lorenzo et al. The Plant Cell, 2017.
arabidopsis_thaliana
FLAG-RPL18 Hypoxia 2h (SRP089899)
Hypoxia
FLAG-RPL18
PAT-seq
Seedling
de Lorenzo et al. The Plant Cell, 2017.
arabidopsis_thaliana
Hypoxia 2h (SRP089899)
Hypoxia
Wild type
PAT-seq
Seedling
de Lorenzo et al. The Plant Cell, 2017.
arabidopsis_thaliana
DRS fpa (ERP003245)
NA
fpa
DRS
Seed
Duc et al. PLoS genetics, 2013.
arabidopsis_thaliana
Seeding Wild Type DRS (ERP003245)
NA
Wild type
DRS
Seed
Duc et al. PLoS genetics, 2013.
arabidopsis_thaliana
Flower (SRP070055)
NA
Wild type
PAT-seq
Flower
Guo et al. Scientific reports, 2016.
arabidopsis_thaliana
Root (SRP070055)
NA
Wild type
PAT-seq
Root
Guo et al. Scientific reports, 2016.
arabidopsis_thaliana
Auxin (SRP092240)
Auxin
Wild type
PAT-seq
Seed
Hong et al. The Plant Journal, 2018.
arabidopsis_thaliana
Mock Control (SRP092240)
Control
Wild type
PAT-seq
Seed
Hong et al. The Plant Journal, 2018.
arabidopsis_thaliana
Amp311 (SRP093950)
NA
Amp311
PAT-seq
Leaf
Lin et al. The Plant Journal, 2017.
arabidopsis_thaliana
Esp5 (SRP093950)
NA
Esp5
PAT-seq
Leaf
Lin et al. The Plant Journal, 2017.
arabidopsis_thaliana
CPSF30 (SRP050424)
NA
CPSF30
PAT-seq
Root
Liu et al. PloS one, 2014.
arabidopsis_thaliana
CPSF30m (SRP050424)
NA
CPSF30m
PAT-seq
Root
Liu et al. PloS one, 2014.
arabidopsis_thaliana
Root Oxt6 Mutant (SRP050424)
NA
Oxt6
PAT-seq
Root
Liu et al. PloS one, 2014.
arabidopsis_thaliana
Root Wild Type (SRP050424)
Control
Wild type
PAT-seq
Root
Liu et al. PloS one, 2014.
arabidopsis_thaliana
Leaf slh1 00hr (SRP033221)
NA
slh1
EXPRSS
Leaf
Rallapalli et al. BMC genomics, 2014.
arabidopsis_thaliana
Leaf slh1 06hr (SRP033221)
NA
slh1
EXPRSS
Leaf
Rallapalli et al. BMC genomics, 2014.
arabidopsis_thaliana
Leaf slh1 09hr (SRP033221)
NA
slh1
EXPRSS
Leaf
Rallapalli et al. BMC genomics, 2014.
arabidopsis_thaliana
Leaf slh1 24hr (SRP033221)
NA
slh1
EXPRSS
Leaf
Rallapalli et al. BMC genomics, 2014.
arabidopsis_thaliana
Leaf Wild Type 00hr (SRP033221)
Control
Wild type
EXPRSS
Leaf
Rallapalli et al. BMC genomics, 2014.
arabidopsis_thaliana
Leaf Wild Type 06hr (SRP033221)
Control
Wild type
EXPRSS
Leaf
Rallapalli et al. BMC genomics, 2014.
arabidopsis_thaliana
Leaf Wild Type 09hr (SRP033221)
Control
Wild type
EXPRSS
Leaf
Rallapalli et al. BMC genomics, 2014.
arabidopsis_thaliana
Leaf Wild Type 24hr (SRP033221)
Control
Wild type
EXPRSS
Leaf
Rallapalli et al. BMC genomics, 2014.
arabidopsis_thaliana
Seeding Wild Type DRS1 (ERP001018)
NA
Wild type
DRS
Seed
Sherstnev et al. Nature structural & molecular biology, 2012.
arabidopsis_thaliana
Seeding Wild Type DRS2 (ERP001018)
NA
Wild type
DRS
Seed
Sherstnev et al. Nature structural & molecular biology, 2012.
arabidopsis_thaliana
Leaf Oxt6 Mutant (SRP009685)
NA
Oxt6
PAT-seq
Leaf
Thomas et al. The Plant Cell, 2012.
arabidopsis_thaliana
Leaf Wild Type (SRP009685)
Control
Wild type
PAT-seq
Leaf
Thomas et al. The Plant Cell, 2012.
arabidopsis_thaliana
AHBD2 (SRP005137)
NA
Wild type
PAT-seq
Seed
Wu X et al. PNAS, 2011.
arabidopsis_thaliana
Hlp1 Mutant (SRP013996)
NA
Hlp1
PAS-seq
Seedling
Zhang et al. Cell research, 2015.
arabidopsis_thaliana
Seedling Wild Type Control (SRP013996)
Control
Wild type
PAS-seq
Seedling
Zhang et al. Cell research, 2015.
arabidopsis_thaliana
Fip1 Mutant (SRP187778)
NA
Fip1
PAT-seq
Seed
Tellez-Robledo et al. The Plant Journal, 2019.
arabidopsis_thaliana
Salt-treated Fip1 Mutant (SRP187778)
Salt-treated
Fip1
PAT-seq
Seed
Tellez-Robledo et al. The Plant Journal, 2019.
arabidopsis_thaliana
Wild Type Control (SRP187778)
Control
Wild type
PAT-seq
Seed
Tellez-Robledo et al. The Plant Journal, 2019.
arabidopsis_thaliana
Salt-treated Wild Type (SRP187778)
Salt-treated
Wild type
PAT-seq
Seed
Tellez-Robledo et al. The Plant Journal, 2019.
bamboo
Latera Bud (SRP093919)
NA
Wild type
PAS-seq
Root
Wang et al. Plant J, 2017.
bamboo
New Shoot Tip (SRP093919)
NA
Wild type
PAS-seq
Root
Wang et al. Plant J, 2017.
bamboo
Rhizome Tip (SRP093919)
NA
Wild type
PAS-seq
Root
Wang et al. Plant J, 2017.
chlamydomonas_reinhardtii
High Salt Acetate (SRP068667)
High Salt Acetate
Wild type
PAT-seq
Media_grown
Bell et al. PloS one, 2016.
chlamydomonas_reinhardtii
High Salt (SRP068667)
High Salt
Wild type
PAT-seq
Media_grown
Bell et al. PloS one, 2016.
chlamydomonas_reinhardtii
Tris Phosphate Acetate (SRP068667)
Tris Phosphate Acetate
Wild type
PAT-seq
Media_grown
Bell et al. PloS one, 2016.
chlamydomonas_reinhardtii
Tris Phosphate (SRP068667)
Tris Phosphate
Wild type
PAT-seq
Media_grown
Bell et al. PloS one, 2016.
medicago_truncatula
AHBG3 Test1 (SRP041219)
NA
Wild type
PAT-seq
Mix
Wu X et al. BMC genomics, 2014.
medicago_truncatula
AHBG3 Test2 (SRP041219)
NA
Wild type
PAT-seq
Mix
Wu X et al. BMC genomics, 2014.
oryza_sativa_indica_group
20 Days Leaf (SRP136202)
NA
Wild type
PAT-seq
Leaf
Zhou et al. The Plant Journal, 2019.
oryza_sativa_indica_group
5 Days Root (SRP136202)
NA
Wild type
PAT-seq
Root
Zhou et al. The Plant Journal, 2019.
oryza_sativa_indica_group
60 Days Leaf (SRP136202)
NA
Wild type
PAT-seq
Leaf
Zhou et al. The Plant Journal, 2019.
oryza_sativa_indica_group
60 Days Root (SRP136202)
NA
Wild type
PAT-seq
Root
Zhou et al. The Plant Journal, 2019.
oryza_sativa_indica_group
60 Days Stem (SRP136202)
NA
Wild type
PAT-seq
Stem
Zhou et al. The Plant Journal, 2019.
oryza_sativa_indica_group
Anther (SRP136202)
NA
Wild type
PAT-seq
Anther
Zhou et al. The Plant Journal, 2019.
oryza_sativa_indica_group
Dry Seed (SRP136202)
NA
Wild type
PAT-seq
Seed
Zhou et al. The Plant Journal, 2019.
oryza_sativa_indica_group
Embryo (SRP136202)
NA
Wild type
PAT-seq
Embryo
Zhou et al. The Plant Journal, 2019.
oryza_sativa_indica_group
Endosperm (SRP136202)
NA
Wild type
PAT-seq
Endosperm
Zhou et al. The Plant Journal, 2019.
oryza_sativa_indica_group
Husk (SRP136202)
NA
Wild type
PAT-seq
Husk
Zhou et al. The Plant Journal, 2019.
oryza_sativa_indica_group
Imbibed Seed (SRP136202)
NA
Wild type
PAT-seq
Seed
Zhou et al. The Plant Journal, 2019.
oryza_sativa_indica_group
Mature Pollen (SRP136202)
NA
Wild type
PAT-seq
Pollen
Zhou et al. The Plant Journal, 2019.
oryza_sativa_indica_group
Pistil (SRP136202)
NA
Wild type
PAT-seq
Pistil
Zhou et al. The Plant Journal, 2019.
oryza_sativa_indica_group
Seeding Shoot (SRP136202)
NA
Wild type
PAT-seq
Seedling
Zhou et al. The Plant Journal, 2019.
oryza_sativa_japonica_group
20 Days Leaf (SRP073467)
NA
Wild type
PAT-seq
Leaf
Fu et al. Genome research, 2016.
oryza_sativa_japonica_group
5 Days Root (SRP073467)
NA
Wild type
PAT-seq
Root
Fu et al. Genome research, 2016.
oryza_sativa_japonica_group
60 Days Leaf (SRP073467)
NA
Wild type
PAT-seq
Leaf
Fu et al. Genome research, 2016.
oryza_sativa_japonica_group
60 Days Root (SRP073467)
NA
Wild type
PAT-seq
Root
Fu et al. Genome research, 2016.
oryza_sativa_japonica_group
60 Days Stem (SRP073467)
NA
Wild type
PAT-seq
Stem
Fu et al. Genome research, 2016.
oryza_sativa_japonica_group
Anther (SRP073467)
NA
Wild type
PAT-seq
Anther
Fu et al. Genome research, 2016.
oryza_sativa_japonica_group
Dry Seed (SRP073467)
NA
Wild type
PAT-seq
Seed
Fu et al. Genome research, 2016.
oryza_sativa_japonica_group
Embryo (SRP073467)
NA
Wild type
PAT-seq
Embryo
Fu et al. Genome research, 2016.
oryza_sativa_japonica_group
Endosperm (SRP073467)
NA
Wild type
PAT-seq
Endosperm
Fu et al. Genome research, 2016.
oryza_sativa_japonica_group
Husk (SRP073467)
NA
Wild type
PAT-seq
Husk
Fu et al. Genome research, 2016.
oryza_sativa_japonica_group
Imbibed Seed (SRP073467)
NA
Wild type
PAT-seq
Seed
Fu et al. Genome research, 2016.
oryza_sativa_japonica_group
Mature Pollen (SRP073467)
NA
Wild type
PAT-seq
Pollen
Fu et al. Genome research, 2016.
oryza_sativa_japonica_group
Pistil (SRP073467)
NA
Wild type
PAT-seq
Pistil
Fu et al. Genome research, 2016.
oryza_sativa_japonica_group
Seedling Shoot (SRP073467)
NA
Wild type
PAT-seq
Seedling
Fu et al. Genome research, 2016.
trifolium_pratense
Flower (SRP186946)
NA
Wild type
PAT-seq
Flower
Chakrabarti et al. Scientific reports, 2018.
trifolium_pratense
Leaf (SRP186946)
NA
Wild type
PAT-seq
Leaf
Chakrabarti et al. Scientific reports, 2018.
trifolium_pratense
Root (SRP186946)
NA
Wild type
PAT-seq
Root
Chakrabarti et al. Scientific reports, 2018.
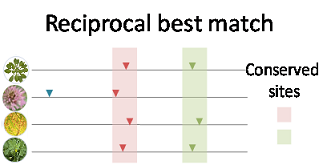
We used the Arabidopsis genome as the reference and obtained pair-wise genome
alignment chain files from the Plant Ensembl to obtain synthetic regions between other
genomes and the reference genome. Then coordinates of PACs of all other species were
converted to coordinates of the reference genome. We adopted the reciprocal best match
method (Wang, et al., 2018) to determine conserved PACs. Briefly, two PACs from two species
was considered as orthologous if their distance was smaller than 25 nt based on the whole
genome alignment. For each PAC in each species, the information of conservation is recorded,
including the species where the conserved sites are found and the corresponding PACs.
Figure 1. The reciprocal best match method used to determine conserved PACs.
id
poly(A) site id
chr
Chromosome of the PAC
start
Start coordinate of the PAC.
end
End coordinate of the PAC.
Strand
Strand
coord
Coordinate of the PAC, which is the coordinate of the most dominate cleavage site in a PAC
ftr
Genomic region the PAC located, e.g., 3UTR, 5UTR, exon, intron, intergenic
gene_id
Respective gene ID
arabidopsis_thaliana
Conserved PAC ID in the respective species
oryza_indica_group
Conserved PAC ID in the respective species
oryza_japonica_group
Conserved PAC ID in the respective species
medicago_truncatula
Conserved PAC ID in the respective species
trifolium_pratense
Conserved PAC ID in the respective species
chlamydomonas_reinhardtii
Conserved PAC ID in the respective species
Wang, R., et al. (2018) PolyA_DB 3 catalogs cleavage and polyadenylation sites identified by deep sequencing in multiple genomes, Nucleic Acids Res, 46, D315-d319.
Upstream and downstream sequences around poly(A) sites located in different genomic regions
(3' UTR, 5' UTR, CDS, intron, intergenic) can be downloaded.
Each sequence is of length 400 nt, with the upstream 300 nt and downstream 100 nt sequence of the
respective poly(A) site cluster (PAC). The poly(A) site is at the 301st position.
You can browse all poly(A) site categories
from APA CATALOGUE, or download poly(A) site atlas
from BULK DOWNLOAD.
Poly(A) sites of each species were classified into four groups based on
their genomic locations (3' UTR, CDS, intron, and 5' UTR) and then 50 top-ranked
signal patterns were
obtained by RSAT for each signal element (e.g., NUE, FUE, CE, DE)
in each group of poly(A) sites.
Based on the single nucleotide profiles surrounding poly(A) sites in different species,
we divided the eight species into two groups, one is Chlamydomonas, the other contains the rest species.
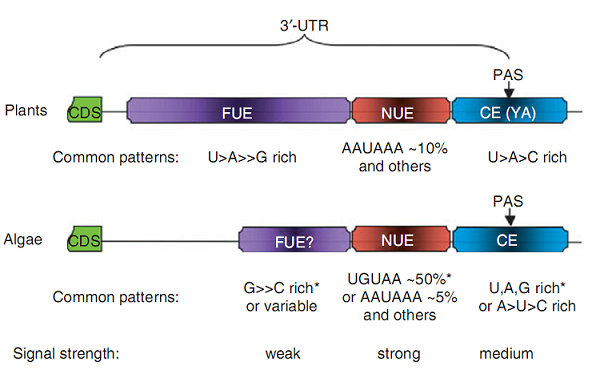
Poly(A) signals of 3' UTR poly(A) sites have been investigated (Xing and Li, 2011).
Figure 2. Polyadenylation signals of nuclear mRNA in plants and representative algae.
The algal signal information was mostly from three species with sequenced genomes:
the green alga Chlamydomonas reinhardtii and two diatoms, Thalassiosira pseudonana and
Phaeodactylum tricornutum. The specific signals of C. reinhardtii are
denoted with *. The signal strength information is for both plants and algae based
on classical genetics (plants) and bioinformatics (algae) analyses. The percentage data were
estimated from the results of bioinformatics analysis. The question mark after FUE implies
that some of the species might not have this signal. CDS, protein coding sequence; UTR,
untranslated region; FUE, far upstream element; NUE, near upstream element;
CE, cleavage element; PAS, poly(A) site; YA, predominant dinucleotide located at the poly(A)
or cleavage site where Y = U or C. The 'A' is the last nucleotide before
poly(A) tail; > or >= indicates that one nucleotide appears more than another.
Not drawn to scale. (This figure is obtained from (Xing and Li, 2011)).
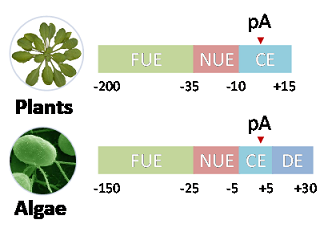
In Chlamydomonas, four signal elements were reported previously, including FUE (-150 to -25, Pentamers),
NUE (-25 to -5, Pentamers), CE (-5 to +5, Heptamers), and DE (+5 to +30, Hexamers) (Shen, et al., 2008).
In the other six species with similar single nucleotide profiles surrounding poly(A) sites, we used the
signal model of Arabidopsis (Loke, et al., 2005), which contains FUE (-200 to -35, Hexamers), NUE (-35 to -10, Hexamers)
and CE (-10 to +15, Hexamers). The choice of signal region range and the respective length of signal patterns
are based on the observation in previous studies (Loke, et al., 2005; Shen, et al., 2008).
Figure 3. Polyadenylation signal regions defined in PlantAPAdb for Chlamydomonas and other plants.
To identify statistically significant signal patterns and sequence logos in a given poly(A) signal region,
we applied an oligo analyzer called regulatory sequence analysis tools, or RSAT (Thomas-Chollier, et al., 2008).
We classified poly(A) sites of each species into four groups based on their genomic locations (3' UTR, CDS, intron, and 5' UTR) and
then obtained 50 top-ranked signal patterns by RSAT for each signal element in each group of poly(A) sites.
rank
Order of the motif
seq
oligomer sequence
id
oligomer identifier
exp_freq
expected relative frequency
occ
observed occurrences
exp_occ
expected occurrences
occ_P
occurrence probability (binomial)
occ_E
E-value for occurrences (binomial)
occ_sig
occurrence significance (binomial)
ovl_occ
number of overlapping occurrences (discarded from the count)
forb_occ
forbidden positions (to avoid self-overlap)
Loke, J.C., et al. (2005) Compilation of mRNA polyadenylation signals in Arabidopsis revealed a new signal element and potential secondary structures, Plant Physiol, 138, 1457-1468.
Shen, Y., et al. (2008) Unique features of nuclear mRNA poly(A) signals and alternative polyadenylation in Chlamydomonas reinhardtii, Genetics, 179, 167-176.
Thomas-Chollier, M., et al. (2008) RSAT: regulatory sequence analysis tools, Nucleic Acids Res., 36, W119-W127.
Xing, D. and Li, Q.Q. (2011) Alternative polyadenylation and gene expression regulation in plants, Wiley Interdisciplinary Reviews: RNA, 2, 445-458.
We adopted four PAC-level metrics and two gene-level metrics to quantify the dynamics of APA across samples.
The PAC-level metrics include the following four metrics. NSE (Number of Samples Expressed): the NSE of a PAC is calculated as the number of samples in which the PAC is expressed.
PSE (Percentage of Samples Expressed): the PSE of a PAC is calculated as the ratio of NSE to the total number of samples.
Ratio: the relative usage of a PAC in a gene, which is calculated as the ratio of the expression level of a PAC to the total expression level of the respective gene.
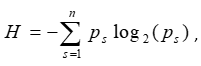
Sample Specificity (Ni et al., 2013; Weng et al., 2016; Hu et al., 2017; Ji et al., 2018): Shannon entropy score was calculated for each PAC to quantify its overall sample specificity:
where n is the number of samples and ps is ratio of the expression level of
the PAC in sample s to the total expression level of this PAC in all samples.
Then the specificity of a PAC for sample s can be calculated as:
Q = H - log2(Ps).
A lower H or Q score means higher sample specificity.
The gene-level metrics include the following two metrics. RUD (Relative Usage of Distal PAC) (Ji et al., 2009; Ji & Tian, 2009): the RUD of a gene in a sample s is calculated as the ratio of the number of 3' reads of the distal PAC in sample s to the number of total reads of proximal and distal PACs in sample s. Here only genes with at least two 3' UTR PACs were used. Proximal and distal PACs are defined as the two most abundant 3' UTR PACs or the two most distant 3' UTR PACs. The RUD score represents the relative 3' UTR length for a gene in a sample, with higher RUD indicating longer 3' UTR.
WUL (Weighted 3' UTR Length) (Ulitsky et al., 2012){Fu, 2016 #3619}: the WUL of a gene in a sample s is calculated as the average 3' UTR length of all 3' UTR PACs in this gene weighted by the number of supported 3' reads of each PAC.
The heatmap for PAC metric of tissue specificity shows the distribution of H values of
each PAC across samples. Here PACs for the plot are first filtered by the following
filtering conditions: total number of reads in all samples >= N1; the percentage of
expressed samples >=N2. Then PACs are ranked by their minimum H values and only the top
N3 PACs are used for the plot.
Similarly, for the heatmap for PAC metric of ratio, PACs are ranked by the variability
(standard deviation) of ratio values across samples.
1) For the heatmap for gene metric of WUL, genes are ranked by the variability
(coefficient of variation) of WUL scores across samples.
2) For the heatmap for gene metric of RUD, genes are ranked by the variability
(standard deviation) of RUD scores across samples.
In the output table of the gene-level metrics, each column is one sample, each row is one gene. The value in the table denotes the RUD or WUL score.
The metrics of NSE and PSE are given in the output table of metric Ratio or Sample Specificity.
Description of output table of metric Ratio. Each row is one PAC named as "GeneID:PAC coordinate".
Sample1~N
Ratio of each sample, here replicates from the same sample are averaged first.
gene
Gene ID
chr
Chromosome
strand
Strand
coord
Coordinate of the PAC
ftr
Genomic region the PAC located
total
Total number of reads across all samples of the PAC
NSE
Number of samples expressed, here a replicate is counted as one sample.
PSE
Percentage of samples expressed, here a replicate is counted as one sample.
Description of output table of metric "Sample Specificity". Columns are the same as those of
metric Ratio except for the following columns.
H
H score of Shannon entropy, reflecting the overall sample specificity of a PAC. Lower value means higher sample specificity.
Q_min
Minimum Q score across all samples.
Q_min_cond
Sample name(s) with minimum Q score (or the highest sample specificity).
Sample1~N
Q score of each sample, reflecting the sample specificity of a PAC in the respective sample. Lower value means higher sample specificity.
Ji Z, Lee JY, Pan Z, Jiang B, Tian B (2009) Progressive lengthening of 3' untranslated regions of mRNAs by alternative polyadenylation during mouse embryonic development. Proceedings of the National Academy of Sciences, USA 106, 7028-33.
Ji Z, Tian B (2009) Reprogramming of 3' untranslated regions of mRNAs by alternative polyadenylation in generation of pluripotent stem cells from different cell types. PloS one 4, e8419.
Ulitsky I, Shkumatava A, Jan CH, et al. (2012) Extensive alternative polyadenylation during zebrafish development. Genome Research 22, 2054-66.
Ni T, Yang Y, Hafez D, et al. (2013) Distinct polyadenylation landscapes of diverse human tissues revealed by a modified PA-seq strategy. BMC Genomics 14, 615.
Fu H, Yang D, Su W, et al. (2016) Genome-wide dynamics of alternative polyadenylation in rice. Genome Research 26, 1753-60.
Weng L, Li Y, Xie X, Shi Y (2016) Poly(A) code analyses reveal key determinants for tissue-specific mRNA alternative polyadenylation. RNA 19, 19.
Hu W, Li S, Park JY, et al. (2017) Dynamic landscape of alternative polyadenylation during retinal development. Cell Mol Life Sci 74, 1721-39.
Ji G, Chen M, Ye W, et al. (2018) TSAPA: identification of tissue-specific alternative polyadenylation sites in plants. Bioinformatics 34, 2123-5.
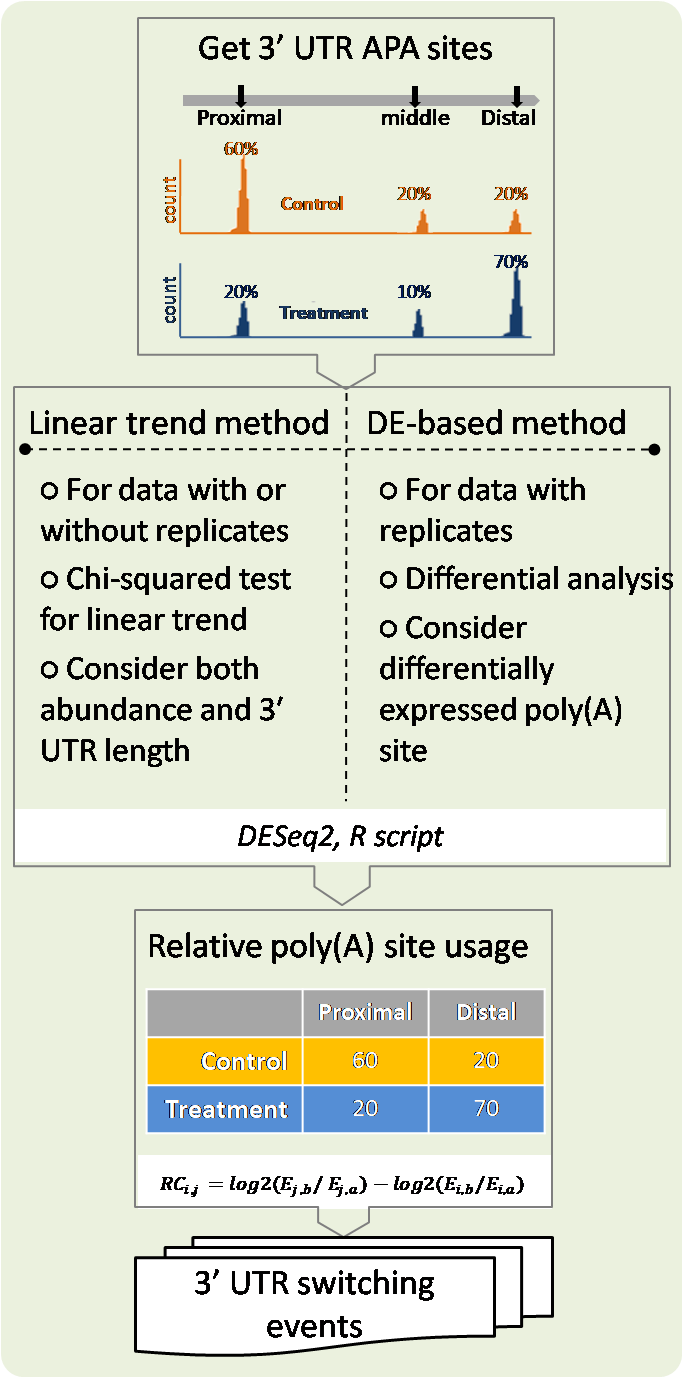
There are two methods for detecting 3' UTR shortening/lengthening events.
The "linear trend" method is based on the chi-squared test for trend in
proportions (Fu, et al., 2011; Fu, et al., 2016; Ye, et al., 2018; Zhou, et al., 2019). The
methods based on DESeq2 extend the differential expression results from DESeq2 to
identify genes with 3' UTR shortening/lengthening events (Arefeen, et al., 2018).
Two strategies were adopted for detecting 3' UTR shortening/lengthening events from samples with or without replicates.
Figure 4. Two strategies were adopted for detecting 3' UTR switching.
The first strategy is based on the chi-squared test for trend in proportions, which is applicable
for samples without replicates (replicates were averaged first). The linear trend method has the advantage to
considers both abundance and 3' UTR length of all 3' UTR PACs in a gene, which was adopted in several previous
APA studies (Fu, et al., 2011; Fu, et al., 2016; Ye, et al., 2018; Zhou, et al., 2019). Briefly, PACs in a gene are sorted by the
respective 3' UTR length (denoted as score). A contingency table of read count is then created with each row representing the indexes
of samples and each column denoting the scores. Next the chi-squared test for trend in proportions is performed
(R function prop.trend.test), and the Pearson correlation r is obtained using the read count in the table as the value and the
score as the coordinate. The correlation r ranges from -1 to 1, with larger absolute value indicating higher extent of 3' UTR
shortening/lengthening. Finally, an adjusted p-value was obtained by the Benjamin method and genes with the adjusted p-value smaller
than a given cutoff (e.g., 0.05) are considered as genes with significant 3' UTR shortening/lengthening.
The second strategy is applicable for samples with replicates, which extends the differential expression (DE)
results from DESeq2 to identify genes with 3' UTR shortening/lengthening events (Arefeen, et al., 2018).
To detect DE PACs, genes with only one PAC were discarded. Then DEXSeq2, initially developed for detecting differential
genes between conditions from RNA-seq, was used for DE PAC identification. For each PAC in APA genes, both p-value
and adjusted p-value were obtained with DEXSeq2, and PACs with adjusted p-value below a given cutoff were considered as DE
PACs. DESeq2 has been adopted in previous studies for detecting differentially expressed poly(A) sites
(Lianoglou, et al., 2013; Fu, et al., 2016; Arefeen, et al., 2018; Zhou, et al., 2019). To detect 3' UTR shortening/lengthening
events, 3' UTR APA genes with at least one DE PAC were filtered. Then the relative change (RC) for this pair of PACs is calculated.
A Fisher's exact test was also performed to test the significance of differential usage of two PACs between two samples, and a p-value
was obtained. Genes with |RC| larger than a given threshold (e.g., 1) and
a p-value below a given cutoff (e.g., 0.05) were considered as genes with 3' UTR shortening/lengthening events.
To identify statistically significant signal patterns and sequence logos in a given poly(A) signal region,
we applied an oligo analyzer called regulatory sequence analysis tools, or RSAT (Thomas-Chollier, et al., 2008).
We classified poly(A) sites of each species into four groups based on their genomic locations (3' UTR, CDS, intron, and 5' UTR) and
then obtained 50 top-ranked signal patterns by RSAT for each signal element in each group of poly(A) sites.
Note: The 3' UTR switching results using different poly(A) site data (normalized or not),
different strategies, or different filtering criteria may vary greatly, we strongly recommend that the
3' UTR switching result provided in PlantAPAdb be used as a guide only.
Organism
Switch group label
Environment condition
Plant type
Procotol
Tissue
Reference
arabidopsis_thaliana
Buffer Control
Control
Wild type
PAT-seq
Seedling
de Lorenzo et al. The Plant Cell, 2017.
arabidopsis_thaliana
Seedling Control
Control
Wild type
PAT-seq
Seedling
de Lorenzo et al. The Plant Cell, 2017.
arabidopsis_thaliana
Cordycepin 2h
Cordycepin
Wild type
PAT-seq
Seedling
de Lorenzo et al. The Plant Cell, 2017.
arabidopsis_thaliana
FLAG-RPL18 Control
Control
FLAG-RPL18
PAT-seq
Seedling
de Lorenzo et al. The Plant Cell, 2017.
arabidopsis_thaliana
FLAG-RPL18 Hypoxia 2h
Hypoxia
FLAG-RPL18
PAT-seq
Seedling
de Lorenzo et al. The Plant Cell, 2017.
arabidopsis_thaliana
Hypoxia 2h
Hypoxia
Wild type
PAT-seq
Seedling
de Lorenzo et al. The Plant Cell, 2017.
arabidopsis_thaliana
Seeding fpa DRS 2012
NA
fpa
DRS
Seed
Duc et al. PLoS genetics, 2013.
arabidopsis_thaliana
Seeding Wild Type DRS 2012
NA
Wild type
DRS
Seed
Duc et al. PLoS genetics, 2013.
arabidopsis_thaliana
Auxin
Auxin
Wild type
PAT-seq
Seed
Hong et al. The Plant Journal, 2018.
arabidopsis_thaliana
Mock Control
Control
Wild type
PAT-seq
Seed
Hong et al. The Plant Journal, 2018.
arabidopsis_thaliana
Amp311
NA
Amp311
PAT-seq
Leaf
Lin et al. The Plant Journal, 2017.
arabidopsis_thaliana
Esp5
NA
Esp5
PAT-seq
Leaf
Lin et al. The Plant Journal, 2017.
arabidopsis_thaliana
CPSF30
NA
CPSF30
PAT-seq
Root
Liu et al. PloS one, 2014.
arabidopsis_thaliana
CPSF30m
NA
CPSF30m
PAT-seq
Root
Liu et al. PloS one, 2014.
arabidopsis_thaliana
Root Oxt6 Mutant
NA
Oxt6
PAT-seq
Root
Liu et al. PloS one, 2014.
arabidopsis_thaliana
Root Wild Type
Control
Wild type
PAT-seq
Root
Liu et al. PloS one, 2014.
arabidopsis_thaliana
Leaf Oxt6 Mutant
NA
Oxt6
PAT-seq
Leaf
Thomas et al. The Plant Cell, 2012.
arabidopsis_thaliana
Leaf Wild Type
Control
Wild type
PAT-seq
Leaf
Thomas et al. The Plant Cell, 2012.
arabidopsis_thaliana
Hlp1 Mutant
NA
Hlp1
PAS-seq
Seedling
Zhang et al. Cell research, 2015.
arabidopsis_thaliana
Seedling Wild Type Control
Control
Wild type
PAS-seq
Seedling
Zhang et al. Cell research, 2015.
arabidopsis_thaliana
Fip1 Mutant
NA
Fip1
PAT-seq
Seed
Tellez-Robledo et al. The Plant Journal, 2019.
arabidopsis_thaliana
Salt-treated Fip1 Mutant
Salt-treated
Fip1
PAT-seq
Seed
Tellez-Robledo et al. The Plant Journal, 2019.
arabidopsis_thaliana
Wild Type Control
Control
Wild type
PAT-seq
Seed
Tellez-Robledo et al. The Plant Journal, 2019.
arabidopsis_thaliana
Salt-treated Wild Type
Salt-treated
Wild type
PAT-seq
Seed
Tellez-Robledo et al. The Plant Journal, 2019.
bamboo
Latera Bud
NA
Wild type
PAS-seq
Root
Wang et al. Plant J, 2017.
bamboo
New Shoot Tip
NA
Wild type
PAS-seq
Root
Wang et al. Plant J, 2017.
bamboo
Rhizome Tip
NA
Wild type
PAS-seq
Root
Wang et al. Plant J, 2017.
chlamydomonas_reinhardtii
High Salt Acetate
High Salt Acetate
Wild type
PAT-seq
Media_grown
Bell et al. PloS one, 2016.
chlamydomonas_reinhardtii
High Salt
High Salt
Wild type
PAT-seq
Media_grown
Bell et al. PloS one, 2016.
chlamydomonas_reinhardtii
Tris Phosphate Acetate
Tris Phosphate Acetate
Wild type
PAT-seq
Media_grown
Bell et al. PloS one, 2016.
chlamydomonas_reinhardtii
Tris Phosphate
Tris Phosphate
Wild type
PAT-seq
Media_grown
Bell et al. PloS one, 2016.
oryza_sativa_indica_group
20 Days Leaf
NA
Wild type
PAT-seq
Leaf
Zhou et al. The Plant Journal, 2019.
oryza_sativa_indica_group
5 Days Root
NA
Wild type
PAT-seq
Root
Zhou et al. The Plant Journal, 2019.
oryza_sativa_indica_group
60 Days Leaf
NA
Wild type
PAT-seq
Leaf
Zhou et al. The Plant Journal, 2019.
oryza_sativa_indica_group
60 Days Root
NA
Wild type
PAT-seq
Root
Zhou et al. The Plant Journal, 2019.
oryza_sativa_indica_group
60 Days Stem
NA
Wild type
PAT-seq
Stem
Zhou et al. The Plant Journal, 2019.
oryza_sativa_indica_group
Anther
NA
Wild type
PAT-seq
Anther
Zhou et al. The Plant Journal, 2019.
oryza_sativa_indica_group
Dry Seed
NA
Wild type
PAT-seq
Seed
Zhou et al. The Plant Journal, 2019.
oryza_sativa_indica_group
Embryo
NA
Wild type
PAT-seq
Embryo
Zhou et al. The Plant Journal, 2019.
oryza_sativa_indica_group
Endosperm
NA
Wild type
PAT-seq
Endosperm
Zhou et al. The Plant Journal, 2019.
oryza_sativa_indica_group
Husk
NA
Wild type
PAT-seq
Husk
Zhou et al. The Plant Journal, 2019.
oryza_sativa_indica_group
Imbibed Seed
NA
Wild type
PAT-seq
Seed
Zhou et al. The Plant Journal, 2019.
oryza_sativa_indica_group
Mature Pollen
NA
Wild type
PAT-seq
Pollen
Zhou et al. The Plant Journal, 2019.
oryza_sativa_indica_group
Pistil
NA
Wild type
PAT-seq
Pistil
Zhou et al. The Plant Journal, 2019.
oryza_sativa_indica_group
Seeding Shoot
NA
Wild type
PAT-seq
Seedling
Zhou et al. The Plant Journal, 2019.
oryza_sativa_japonica_group
20 Days Leaf
NA
Wild type
PAT-seq
Leaf
Fu et al. Genome research, 2016.
oryza_sativa_japonica_group
5 Days Root
NA
Wild type
PAT-seq
Root
Fu et al. Genome research, 2016.
oryza_sativa_japonica_group
60 Days Leaf
NA
Wild type
PAT-seq
Leaf
Fu et al. Genome research, 2016.
oryza_sativa_japonica_group
60 Days Root
NA
Wild type
PAT-seq
Root
Fu et al. Genome research, 2016.
oryza_sativa_japonica_group
60 Days Stem
NA
Wild type
PAT-seq
Stem
Fu et al. Genome research, 2016.
oryza_sativa_japonica_group
Anther
NA
Wild type
PAT-seq
Anther
Fu et al. Genome research, 2016.
oryza_sativa_japonica_group
Dry Seed
NA
Wild type
PAT-seq
Seed
Fu et al. Genome research, 2016.
oryza_sativa_japonica_group
Embryo
NA
Wild type
PAT-seq
Embryo
Fu et al. Genome research, 2016.
oryza_sativa_japonica_group
Endosperm
NA
Wild type
PAT-seq
Endosperm
Fu et al. Genome research, 2016.
oryza_sativa_japonica_group
Husk
NA
Wild type
PAT-seq
Husk
Fu et al. Genome research, 2016.
oryza_sativa_japonica_group
Imbibed Seed
NA
Wild type
PAT-seq
Seed
Fu et al. Genome research, 2016.
oryza_sativa_japonica_group
Mature Pollen
NA
Wild type
PAT-seq
Pollen
Fu et al. Genome research, 2016.
oryza_sativa_japonica_group
Pistil
NA
Wild type
PAT-seq
Pistil
Fu et al. Genome research, 2016.
oryza_sativa_japonica_group
Seedling Shoot
NA
Wild type
PAT-seq
Seedling
Fu et al. Genome research, 2016.
trifolium_pratense
Flower
NA
Wild type
PAT-seq
Flower
Chakrabarti et al. Scientific reports, 2018.
trifolium_pratense
Leaf
NA
Wild type
PAT-seq
Leaf
Chakrabarti et al. Scientific reports, 2018.
trifolium_pratense
Root
NA
Wild type
PAT-seq
Root
Chakrabarti et al. Scientific reports, 2018.
Note: Samples without at least two replicates were not used for APA switching analysis.
Regulation: shorter/longer means only the switching events that with shorter/longer 3' UTR in group 2 are filtered.
Fisher's exact test p-value: the p-value cutoff to filter significant switching events (for methods of DESeq2).
Log fold change: the cutoff of log fold change of the expression levels of poly(A) sites between the two samples (for methods of DESeq2).
Adjusted p-value: the cutoff of the adjusted p-value of the chi-squared test for trend in proportions (for linear trend method).
gene
Gene id
nPAC
Number of poly(A) sites in the gene
geneTag1
Number of total reads of the gene in the first sample
geneTag2
Number of total reads of the gene in the second sample
avgUTRlen1
Average 3' UTR length of the gene in the first sample
avgUTRlen2
Average 3' UTR length of the gene in the second sample
fisherPV
Fisher's test p-value (for the method of DESeq2)
logFC
Log fold change of the expression levels of poly(A) sites between the two samples (for methods of DESeq2)
padj
Adjusted p-value (for linear trend method)
cor
Correlation value (for linear trend method)
logRatio
Log ratio of the expression levels of poly(A) sites between the two samples (for linear trend method)
Change
Longer means 3' UTR is longer in the second sample, Shorter means 3' UTR is shorter in the second sample
PAs1
The expression levels of poly(A) sites in the first sample
PAs2
The expression levels of poly(A) sites in the second sample
Fu, Y., et al. (2011) Differential genome-wide profiling of tandem 3' UTRs among human breast cancer and normal cells by high-throughput sequencing, Genome Res., 21, 741-747.
Lianoglou, S., et al. (2013) Ubiquitously transcribed genes use alternative polyadenylation to achieve tissue-specific expression, Genes Dev., 27, 2380-2396.
Fu, H., et al. (2016) Genome-wide dynamics of alternative polyadenylation in rice, Genome Res., 26, 1753-1760.
Arefeen, A., et al. (2018) TAPAS: Tool for Alternative Polyadenylation Site Analysis, Bioinformatics, bty110-bty110.
Ye, C., et al. (2018) APAtrap: identification and quantification of alternative polyadenylation sites from RNA-seq data, Bioinformatics, 34, 1841-1849.
Zhou, Q., et al. (2019) Differential alternative polyadenylation contributes to the developmental divergence between two rice subspecies Japonica and Indica, The Plant Journal, 98, 260-276.
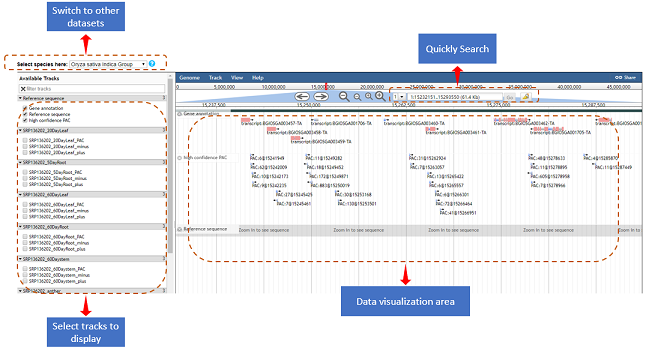
Users can have a quick access to the PAC browser by clicking the
"PAC browse" tab in the main menu or the “View” link in a PAC list.
Figure 5. Web page of the browser.
One or more data sets from each plant species can be quickly loaded and
graphically browsed online, by selecting the checkboxes of data sets in the
‘Available Tracks' panel. Users can conduct a search with a gene or chromosome
fragment to zoom in on particular PAC regions. Data tracks of PACs from different
cells, tissues or conditions can be displayed in sync with tracks of PATs, offering
a more intuitive way to explore and compare the usage of PACs among different samples.
Users can download the data of one or more tracks onto their local computers.
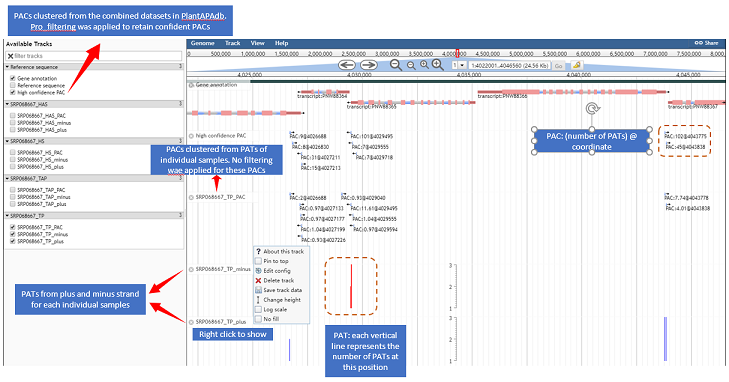
Figure 6. Right-click context menu on a gene model or PAC
In addition to cataloging PAC from individual samples, PlantAPAdb also provides the
PAC list of pooled samples for bulk download. For the pooled data, different files
are available for download to meet the users' need. The file in bed format records
simple information such as chromosome, strand, coordinate, and total number of reads
for each PAC. The file in text format tabulates full information of each PAC, including
the total read count, the raw and TPM normalized read count in each individual sample and
replicate, the respective gene, genomic location (CDS, intron, 3' UTR, 5' UTR, intergenic, etc.),
distance to neighbor genes (if the PAC is located in intergenic region). Moreover, files of
heterogeneous cleavage sites in bed format were also provided, which allows users to inspect
the polyadenylation in higher resolution.
1) All poly(A) site clusters in BED format
This file contains all poly(A) site clusters (PACs) with the information of chromosome, strand, coordinate, and score (raw read count from the pooled samples) for each PAC. Internal priming artifacts were removed. Cleavage sites within 24 nt of each other were grouped into one PAC.
2) All poly(A) site clusters with annotation (raw count)
This file contains full information of all PACs. The expression level (number of supported reads) for each PAC in each experiment is given. The annotation including the gene, gene type, genomic region, number of cleavage sites etc. for each PAC is also given.
ftr
Genomic region of the PAC, including three prime utr (3'UTR), five prime utr (5'UTR), cds, intron, exon, and intergenic.
gene_id
Gene id
biotype
Gene type, such as protein_coding, long non-conding RNA (lncRNA), non-coding RNA (ncRNA), tRNA.
ftr_start
Start coordinate of the genomic region ("ftr" column)
ftr_end
End coordinate of the genomic region ("ftr" column).
upstream_id
5' gene id of a PAC, only valid when the PAC is located in intergenic region.
upstream_start
Start coordinate of the 5' gene, only valid when the PAC is located in intergenic region.
upstream_end
End coordinate of the 5' gene, only valid when the PAC is located in intergenic region.
downstream_id
Same as upstream_id, except for the 3' gene.
downstream_start
Same as upstream_start, except for the 3' gene.
downstream_end
Same as upstream_end, except for the 3' gene.
3) All poly(A) site clusters with annotation (TPM count)
This file contains full information of all PACs and the expression levels were
normalized by Tag Per Million.
Given a PAC table pac_sample, the TPM normalization is performed in R as follows:
4) High confidence poly(A) site clusters in BED format
This file contains only high confidence PACs which are expressed (TPM>=1) in at least two experiments.
5) High confidence poly(A) site clusters with annotation (raw count)
This file contains only high confidence PACs with full annotation.
6) All cleavage sites
This file contains all cleavage sites, which has four columns: chromosome, strand, coordinate, and number of supported reads. This file was used for generating poly(A) site clusters.
7) Full sample list
This file contains the information of the full sample list in PlantAPAdb, including the SRR id, sample name,
environmental condition, plant type, tissue, sequencing protocol, reference, read statistics.
Pipeline: Genome-wide identification of polyadenylation sites from 3'-end sequencing data in plants.
1 Overview
Our current PlantAPAdb database for identifying poly(A) sites relies on bioinformatics tools.
We developed a framework for genome-wide identification of poly(A) sites from 3'-end sequencing
data (3'-seq) in plants. Scripts for APA analyses in PlantAPAdb can be downloaded here.
Install the following tools:
A alignment software, such as STAR (recommend),
Bowtie/Bowtie2, and TopHat.
# Get latest STAR source from releases
wget https://github.com/alexdobin/STAR/archive/2.7.1a.tar.gz
tar -xzf 2.7.1a.tar.gz
cd STAR-2.7.1a

# Alternatively, get STAR source using git
git clone https://github.com/alexdobin/STAR.git
Make
sure Perl and related modules (details in ourPerl scripts) are installed on your computer
#The Perl version can be checked with the command
perl –version
#install Perl modules on Linux/Unix/Mac OS
#upgrade cpan
perl -MCPAN -e shell
#Install or upgrade Module::Build, and make it your preferred installer
cpan>install Module::Build
cpan>o conf prefer_installer MB
cpan>o conf commit
#install Bio::SeqIO module
cpan>install Bio::SeqIO
Make sure bedtools
and bedmap are installed on your computer
#install bedtools on Linux/Unix/Mac OS
apt-get install bedtools
#install bedmap
wget –c https://github.com/bedops/bedops/releases/download/v2.4.36/bedops_linux_x86_64-v2.4.36.tar.bz2
tar jxvf bedops_linux_x86_64-vx.y.z.tar.bz2
cp bin/* /usr/local/bin
[Optional] You can
install SRA Toolkit to
download raw sequence data,
and then use Trimmomatic
or FASTX for quality trimming and adapter removal.
Prepare the following sequence data
A reference genome. You can download the reference genome (fasta format) from
public databases, such as Ensembl,
NCBI
and UCSC. In addition,
the annotation file (gtf/gff3 format) can also be downloaded. For example, the reference genome of Arabidopsis thaliana (TAIR10)
is obtained from Ensembl.
#download reference genome
wget –c ftp://ftp.ensemblgenomes.org/pub/plants/release-43/fasta/arabidopsis_thaliana/dna/Arabidopsis_thaliana.TAIR10.dna.toplevel.fa.gz
#download annotation gff3 file in gff3 format
wget –c ftp://ftp.ensemblgenomes.org/pub/plants/release-43/gff3/arabidopsis_thaliana/Arabidopsis_thaliana.TAIR10.43.gff3.gz
3'-seq data. We can download 3'-seq data (fastq format) from public sequence repositories.
For example, the data (SRR5055885/ SRR5055884/ SRR5055883)of Arabidopsis thaliana is downloaded from the
Sequence Read Archive by SRA Toolkit.
#download sra
prefetch SRR5055885 SRR5055884 SRR5055883
#turn convert into fastq format
fastq-dump –O  /output-path/  SRR4243494.sra
3 Analysis Workflow
To illustrate the analysis workflow, the PAT-seq data (SRR5055885/SRR5055884/ SRR5055883) from Arabidopsis thaliana are taken as an example, which
include three replicates and the reads are with poly(A) tail.
3.1 Data Processing
MAP_findTailAT.pl is an in-house Perl script
for identifying reads with valid poly(A) tail and trimming poly(A) tail.
Usage
perl MAP_findTailAT.pl -h
For example,
perl MAP_findTailAT.pl -in ./SRR5055885.fastq -poly T -ml 25 -mp 6 -mg 5 -mm 2 -mr 2  -mtail 6 -debug F -bar 8 -odir "/output-path/" -suf "SRP093950"
#######################################################################
#-in=input fa or fq file
#-poly=A/T/A&T/A|T. -poly=A if the sequence with As tail, -poly=T if the sequence with Ts tail
#-ml=min length after poly(A)trimming
#-mp=min length of succesive poly (default=8)
#-mg=margin from the start (poly=T) or to the end (poly=A) (=5)
#-mm=mismatch between TNNTTT or ANNAAA (default=2)
#-mr=minT in reg (default=3)
#-mtail=min length of trimmed tail (default=8)
#-bar=the length of barcode if there is barcode
#-odir=output path (default is the same as input)
#-suf=suffix, default: xx.suf.T/A.fq
#-debug=T/F (default=T)
Then we can use Trimmomatic to
remove adapter sequences and low quality reads.
Then we can map clean PAT-seq data to the reference genome.
STAR --runThreadN 20 \
     --readFilesIn ./clean.SRR5055885.fq
     --genomeDir ./index \
     --outFileNamePrefix   ./leaf-esf-rep1\
     --outMultimapperOrder Random \
     --outFilterMultimapNmax 1
The output file "leaf-esf-rep1Aligned.out.sam" is the alignment result (sam format). For the data SRR5055884 and SRR5055883,
we will get the alignment result "leaf-esf-rep2Aligned.out.sam" and "leaf-esf-ref3Aligned.out.sam", respectively.
3.3 Identification of Polyadenylation Sites
PAT2PA2PAC.sh is a shell script that identifies poly(A) sites by using in-house
Perl scripts, bedtools and bedmap.
This script mainly consists of two steps:
1) Identifying poly(A) sites by filtering out internal-priming reads;
2) grouping poly(A) tags into poly(A) site clusters (PAC).
Usage:
The above workflow will produce multiple output files.
a) all.PAC.header – is the column name of output file "all.PAC.PATcount".
"chr" - is name of the chromosome or scaffold;
"UPA_start" - is the start position of the PAC, with sequence numbering starting at 1.
"UPA_end" - is the end position of the PAC, with sequence numbering starting at 1.
"strand" - is the direction of PAC, defined as + (forward) or – (reverse)
"PAnum" - is the number of poly(A) site in the PAC region.
"tot_tagum" - is the total expression level of all samples in the PAC region (count).
"coord" - represents reference poly(A) sites in the PAC region.
"refPAnum" - is the number of poly(A) site in this "coord"
"sampleName" - is the PAC expression level of each sample (count).
c) all.PAC.info – is the part of "all.PAC.PATcount" with first 8 columns, including "chr", "UPA_start", "UPA_end",
"strand", "PAnum", "tot_tagnum",
"coord", "refPAnum".
d) all.PAC.PAcount – is the number of poly(A) sites for each sample in the PAC region, corresponding columns are "chr", "UPA_start", "UPA_end",
"strand", "PAnum", "tot_tagnum",
"coord", "refPAnum", "samplePAnum".
Poly(A) sites were annotated with respective genes, genomic locations, etc.
based on the latest genome annotations. An R script based on the GenomicFeatures R package was
implemented to uniformly process the genome annotation file in GFF3 format. Annotation for both
protein coding genes and non-coding genes were parsed. PACs were then annotated based on their
genomic locations, i.e., 3' UTR, coding sequence (CDS) for protein coding genes, intron and exon
for non-coding genes, and intergenic region. To resolve annotation ambiguity owing to multiple
transcripts from the same gene, we annotated a PAC based on the following priority: 3' UTR, CDS, intron.
Particularly, if a PAC is located in intergenic region, we recorded the neighboring genes and its
distance from the 3' end of the nearby 5′ gene and the distance from the 5′ end of the nearby 3' gene.
This strategy to annotate intergenic PACs allows annotation of PACs with higher flexibility to recruit
PACs falling within extended 3' UTR regions.
Extended 3' UTR is defined as the downstream region of the annotated 3' UTR or the gene end
(if there is no annotated 3' UTR). In PlantAPAdb, the length of extended 3' UTR region is defined
as twice of the average length of annotated 3' UTRs. According to genome annotations used in PlantAPAdb,
the average 3' UTR lengths are: arabidopsis_thaliana = 276, chlamydomonas_reinhardtii = 850,
medicago_truncatula = 401, oryza_sativa_japonica_group = 322, oryza_sativa_indica_group = 322,
trifolium_pratense = 207, bamboo = 498.
For APA switching analyses, PACs located in extended 3' UTR were also considered as 3' UTR PACs
for identifying 3' UTR lengthening or shortening.